TMS IntraWeb HTML5 Controls Pack 2.4.0.0 Full Source
TMS IntraWeb HTML5 Controls Pack 2.4.0.0 Full Source
TMS IntraWeb HTML5 Controls pack focuses on controls that take advantage of HTML5 capabilities to give a new powerful dimension to your IntraWeb web applications, including low bandwidth usage and ultra fast asynchronous updates. Currently the pack contains four controls: TTIWHTML5Chart, TTIWHTML5Gauge, TTIWHTML5PieChart and TTIWHTML5LocalStorage.
TTIWHTML5Chart
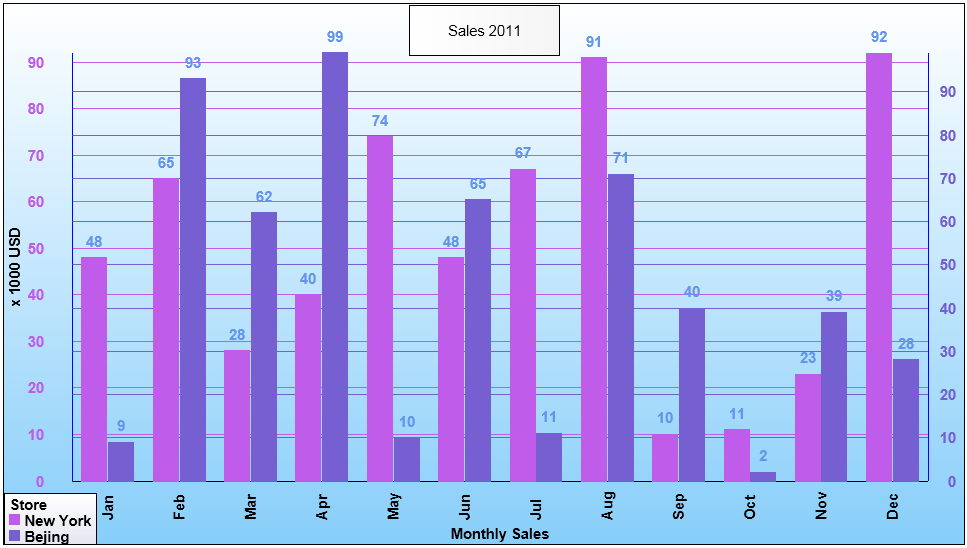
This component is designed to render various chart types in a browser using HTML5/CSS3/jаvascript. The component currently offers following chart types: bar, area, line, stacked area, stacked bar and xy. Multiple series can be simultaneously shown in the chart.
Different chart modes: area, bar, line, stacked area, stacked bar, xy.
Automatic display of a legend in both vertical and horizontal mode.
Annotations and value labels can be added to series points for any chart type.
A 3D effect can be optionally applied to each chart type.
Square, circle, rectangle or image markers on series points can be set for chart types: line, area, stacked area and xy.
A separate item layer is available to add any type of additional information on the chart at a position of choice, either on top of the series or below.
Customizable text in X-axis, Y-axis and different X-axis, Y-axis per series.
Automatic axis range calculation or configurable range.
Configurable helper lines and color banding.
Asynchronous updatable single series point or entire series and asynchronous updates of series properties, chart properties.
Different asynchronous events to handle clicks on various parts of the chart.
Display of series points values as hint on mouse-over.
Full asynchronous update support.
Different gauge types: circular, linear horizontal and linear vertical
Triangle, arrow, line, double line or image needle type can be set for linear gauge types
Triangle, square, circle or line SetPoints types can be set for all gauge types
Multiple configurable sections can be added for all gauge types
Minimum and maximum with divisions and subdivisions
Informative DialText and formatted value display
Asynchronous event to handle clicks on the gauge
Full asynchronous update support
Display one or more exploded segments.
Display pie chart as a full circle or a partial circle.
Automatic display of a legend in both vertical and horizontal mode.
A shadow effect can be optionally applied.
Apply different animation effects.
Display segment values as hint on mouse-over.
Asynchronous events to handle clicks on segments.
Full asynchronous update support.
Warning! You are not allowed to view this text.