TMS FlexCel for VCL & FMX v6.26.0.0 Full Source

TMS FlexCel for VCL & FMX v6.26.0.0 Full Source
Powerful, extensive & flexible component suite for native Excel report & file generation & manipulation for VCL & FireMonkey.
FlexCel for VCL / FireMonkey is a suite of Delphi components allowing to manipulate Excel files. It includes an extensive API allowing to natively read/write Excel files. If you need to read or create complex spreadsheets, on Windows or macOS on machines without Excel installed, Flexcel can do the job.
Support for cross platform use: Win32, Win64, macOS, iOS, Android and Linux
100% Native support for creating Excel .XLS, .XLSX, .XLSM file formats (Excel 97 - Excel 2019)
100% Native support for reading Excel 2 - Excel 2019 files
100% Native PDF report generation from .XLS/.XLSX files (PDF/A 1, 2 and 3 support)
100% Native support for previewing and printing .XLS/.XLSX files
Fully standards compliant HTML 5 file generation from .XLS/.XLSX files
Export .XLS & .XLSX files to SVG
Report Engine that allows to create complex reports using Excel as your report designer, so your final users can modify them. You can use images/comments/conditional formats/merged cells/pivot tables/charts and almost anything you can think of on those reports
Support for formula recalculation supporting over 300 Excel functions
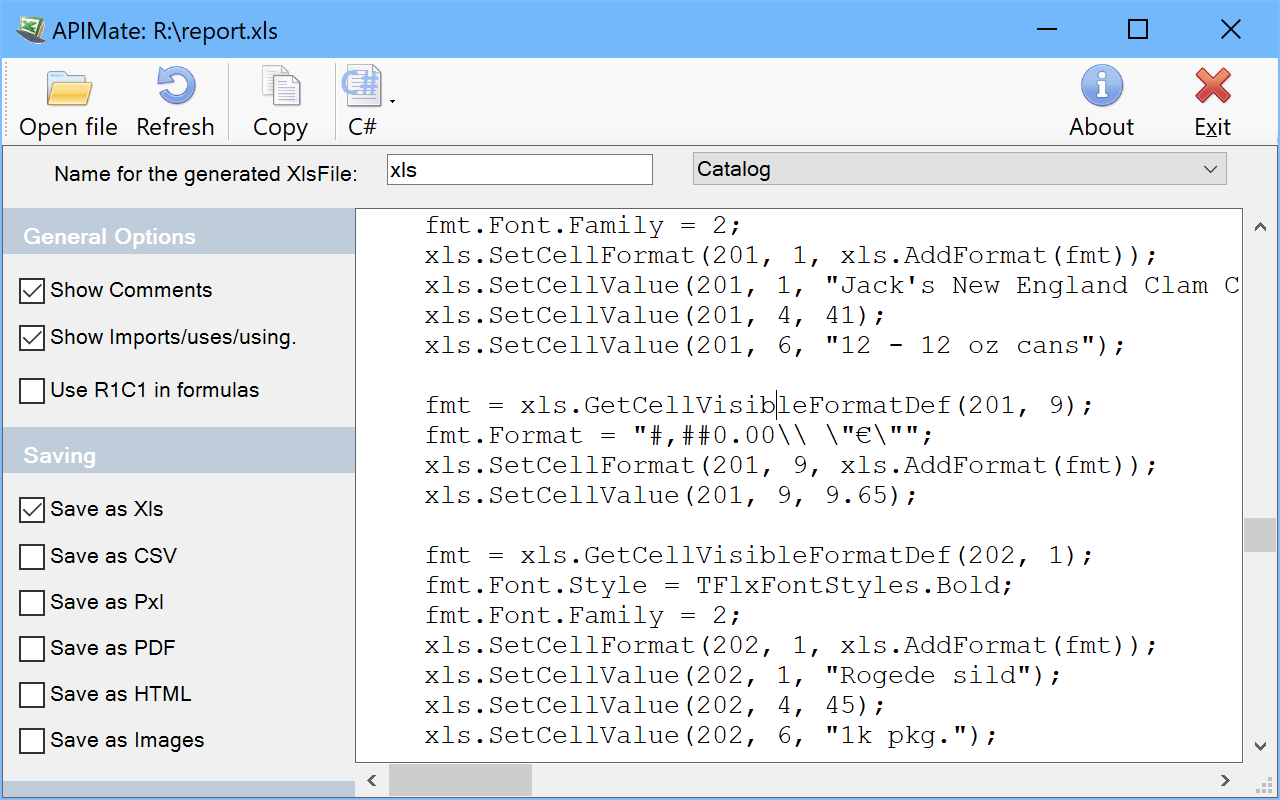
ApiMate tool for automatically showing needed Delphi/C++ code for generating specific .XLS/.XLSX file cells with Flexcel
Templates can be embedded inside your exe. No additional files to distribute
Can write images/comments/conditional formats/merged cells/pivot tables/charts and almost the complete Excel feature set in native mode
Designed from start to make full use of modern Delphi features like records with methods or generics.
Also available as a fully managed .NET library
Fully documented. FlexCel has a documentation center with guides, tips, full reference for every method and more than 50 working examples to help you get started.
v6.26.0.0 (March 16, 2019)
New : In Reports now you can reference tables which include dots by writing <#[db.something].field>
Improved : Now FlexCel won't throw an exception when reading custom properties in an xls file if the values of the property aren't defined
Improved : Improved compatibility with LibreOffice/OpenOffice
Fixed : Workaround a GDI+ bug which could cause Internal errors when using small path gradients.
Fixed : When rendering charts, if the axis was reversed and the labels were aligned to the right, FlexCel would render them to the left and vice-versa.
Fixed : The setup wasn't compiling c++ headers for Android and iOS in Rad Studio Rio.
Fixed : If an xlsx file contained negative offsets to a shape, FlexCel could render the shape incorrectly.
Fixed : FlexCel would fail to read xlsx files with formulas that contained unknown user defined functions that returned a reference type.
Fixed : FlexCel will now render labels in stacked charts more like Excel renders them.
Fixed : FlexCel will now render labels in a 100% stacked chart as the values, not the percent in the charts.
 Only for V.I.P
Warning! You are not allowed to view this text.