AnyChart v8.9.0
AnyChart v8.9.0
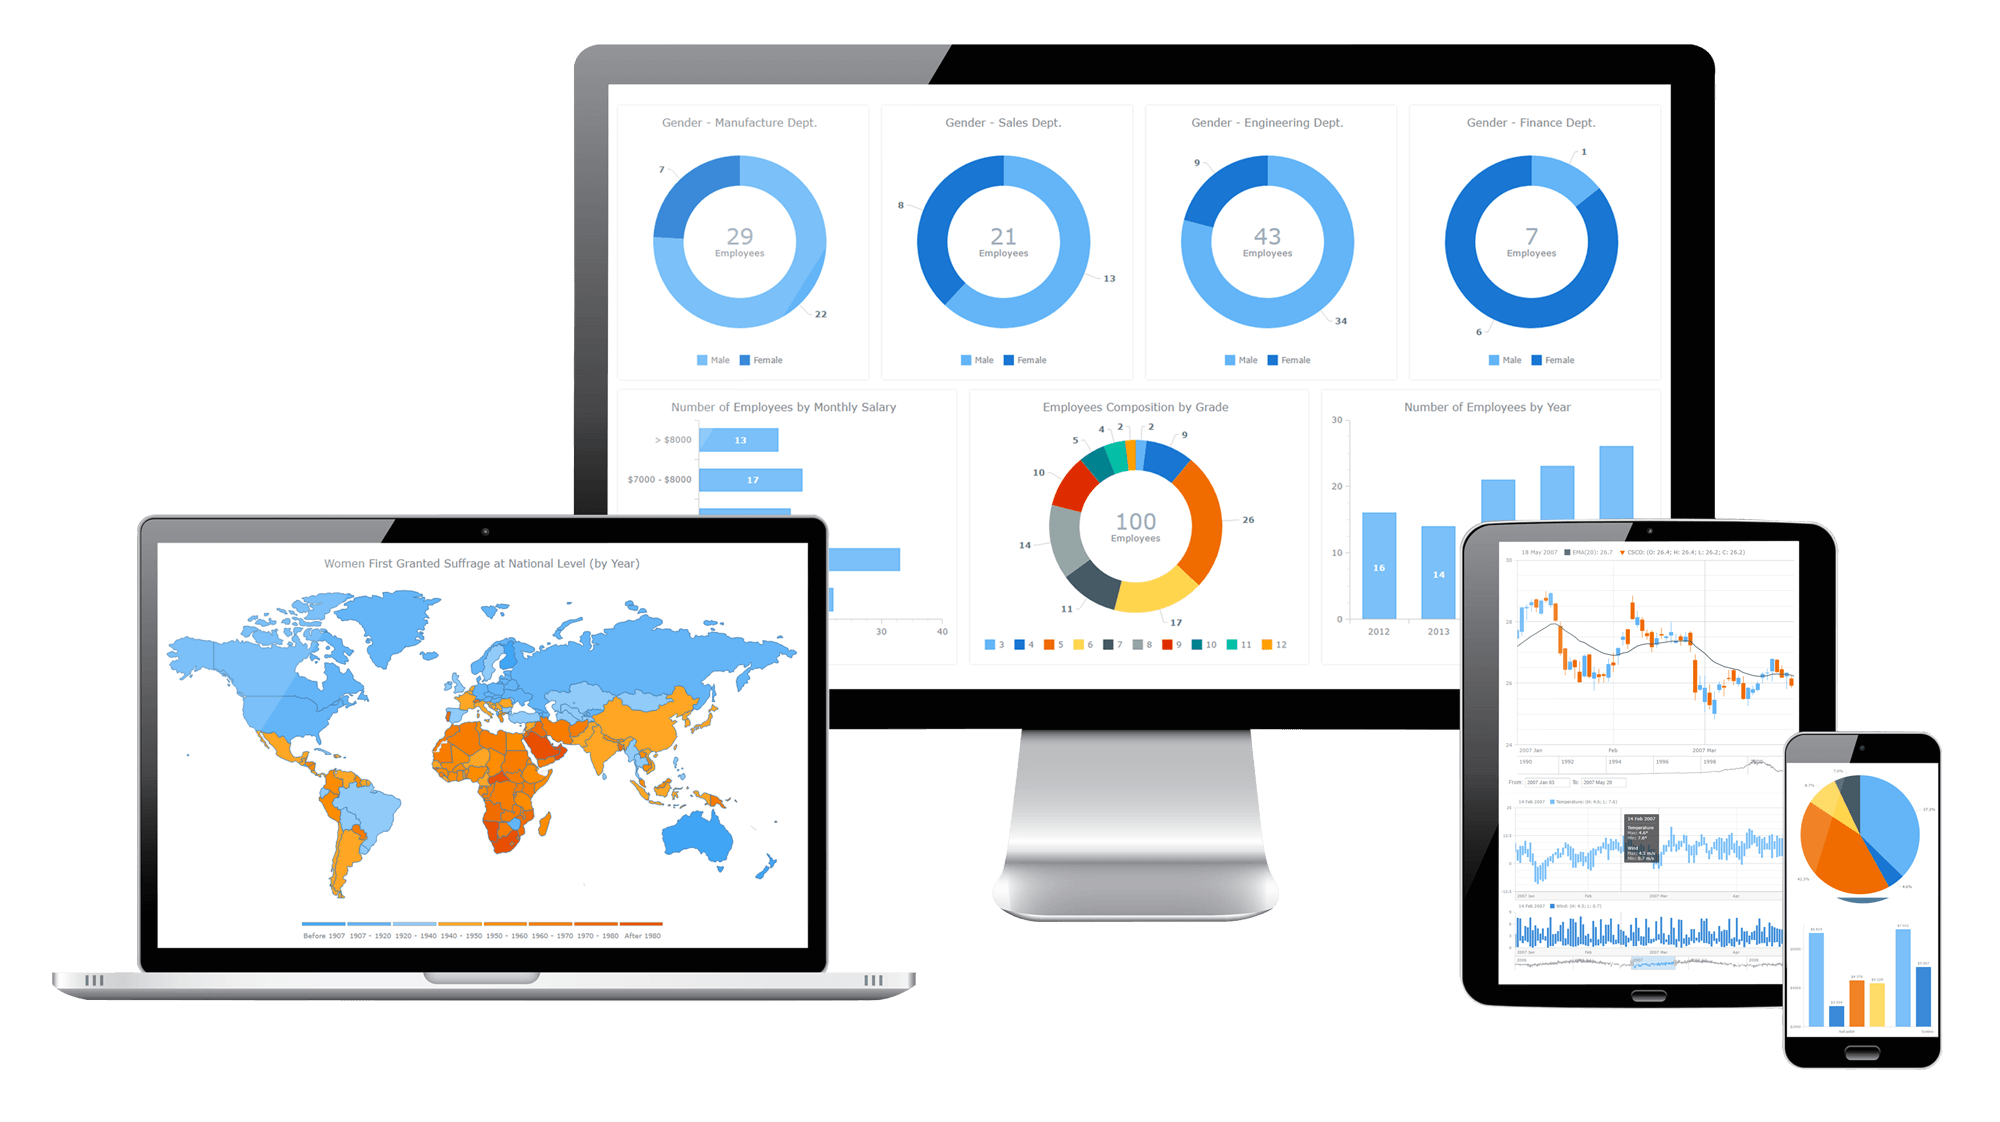
Interactive jаvascript charts designed to be embedded and integrated into web, desktop, and mobile apps. Visualize and analyze financial or any timeline-based data.
AnyMap - HTML5 maps
Add interactive map charts with drilldown and routes
AnyGantt - JS Gantt charts
Powerful HTML5 Gantt, Resource and PERT charts
AnyСhart Extension for Qlik
Enhance the Qlik Platform with the power of AnyChart
AnyChart's product family is a set of flexible jаvascript (HTML5) libraries for all your data visualization needs. Differentiate your products, applications and web pages with beautiful charts and dashboards.
Why AnyChart?
Any Chart Type: Pie and Donut , Column , Bar , Line , Scatter , Cherry , Area , Range Column ,
Win/Loss Sparklines , Pareto Charts and more
Any Development Stack: PHP, ASP.NET, R, Ruby on Rails, Node.JS, Angular, Meteor,
Ember, React, Qlik, jQuery and more
Any Feature: Chart types, Big Data, Themes, Drawing Tools, Localization,
Technical Indicators and more
Any Data Source: XML, JSON, CSV, MySQL, MongoDB and more
Load JSON data and create a JS chart
jаvascript Object Notation can be used to load data to your JS charts.
Interactive jаvascript charts designed to be embedded and integrated into web, desktop, and mobile apps
Chart Types
Big Data
Chart Design
Drawing Tools
Technical Indicators
Localizations
Five Resources To Learn AnyChart
Exporting And Sharing
Business Solutions And Dashboards
Samples For Your Stack
Big Data Charts
Our jаvascript charts support rendering thousands of data points in milliseconds. Run a speedtest or try real-time live data streaming.
Your Charts, Your Design
It is easy to adjust look and feel of your charts using themes and palettes - AnyChart includes set of pre-built sets or you can create your own scheme.
Drawing Tools And Annotations
Need to show additional information or annotations? It is really easy with AnyChart drawing tools. Try it right now!
Technical Indicators
Need to analyze your data? Our JS charts include dozens of pre-built technical indicators and you can easily create your own.
Localizations
Building international or multi-language solution? No problems - we speak any language!
AnyChart provides 194 predefined locale files, and you can build your own as well.
Five Resources To Learn AnyChart
Each day we doing out best to make AnyChart learning process as easy and convenient as possible
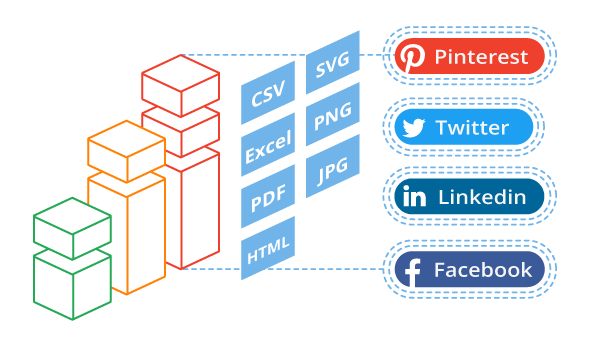
Exporting And Sharing
You can easily share a chart made with AnyChart jаvascript library to a social network like Facebook, Pinterest, Twitter and LinkedIn. Also it allows implementing custom integration with any other social network using image sharing functions. And of course, you can save a chart as an image in PDF, PNG, JPG or SVG formats or download chart data as Excel or CSV file.
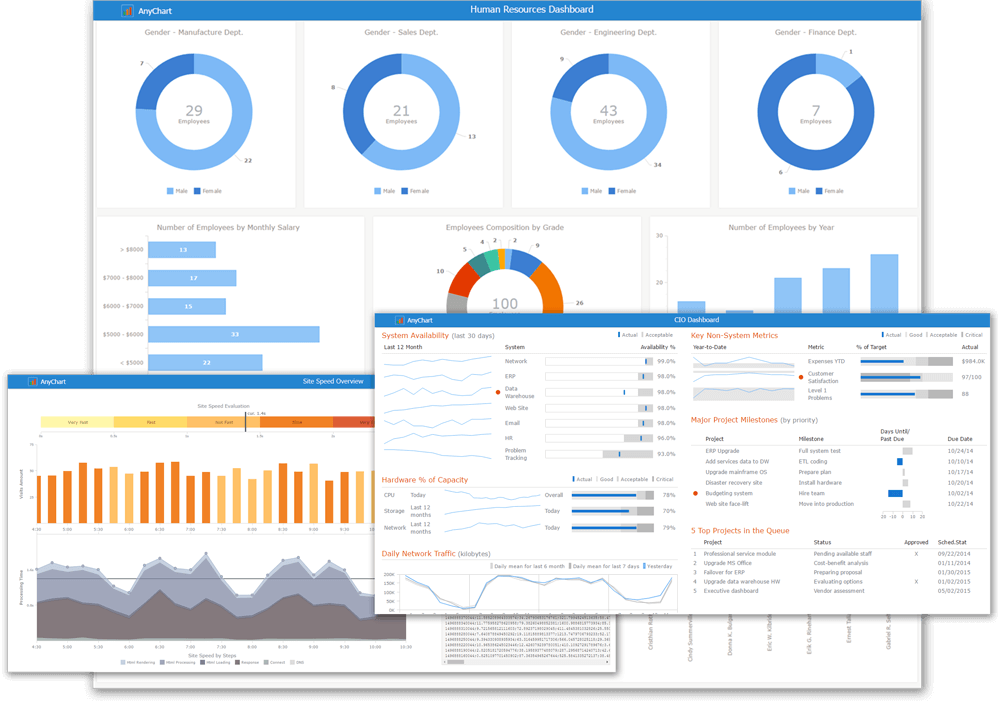
Business Solutions And Dashboards
Business intelligence dashboards arrange numbers, metrics and performance scorecards on a single screen. Dashboards help executives, management, and employees to view KPI's and assess the situation. BI dashboards help to understand the data and improve the efficiency of an organization.
AnyChart provides many sample web-applications with interactive BI dashboards. Every interactive jаvascript dashboard in these apps is created with AnyChart.
Thousands of companies already use AnyChart to create interactive dashboards. Join us and build your own!
Are you building Sales Dashboard, Site Speed Monitor, CIO Dashboard, Investment Portfolio, Human Resources Dashboard, Technical Support Dashboard? AnyChart can do this and more.