Redgate ANTS Performance Profiler 10.1.0.1067

Redgate ANTS Performance Profiler 10.1.0.1067
Boost the performance of your applications with .NET profiling. ANTS Performance Profiler is a .NET profiler for desktop, ASP.NET, and ASP.NET MVC applications.
NEW: Profile your SQL queries and see execution plans
Find performance bottlenecks fast by profiling both the .NET code and the data access layer
Get rich performance data, right-down to line-level timings and expensive database queries
Save time going round in circles diagnosing and debugging – let the profiler do the hard work for you
Explore unfamiliar code bases
Enhanced data access profiling, with support for SQL Server, Oracle, MySQL, MariaDB, and PostgreSQL
All the performance data you need in a single .NET profiler
From .NET code to database
View performance data for both your .NET code and database requests made by the .NET code.
Profile database requests your application makes to any SQL Server, Oracle, MySQL (or MariaDB), and PostgreSQL database.
This is ideal if you're using an ORM.
Read more about our database profiling support, on Simple-Talk.com
Understand web requests
View rich data about outbound HTTP requests made by your application, including request and response header information.
See all the information in the context of the .NET code which caused the request to run.
File I/O performance
Get comprehensive performance information on your application's disk activity.
Jump straight to the slowest activity
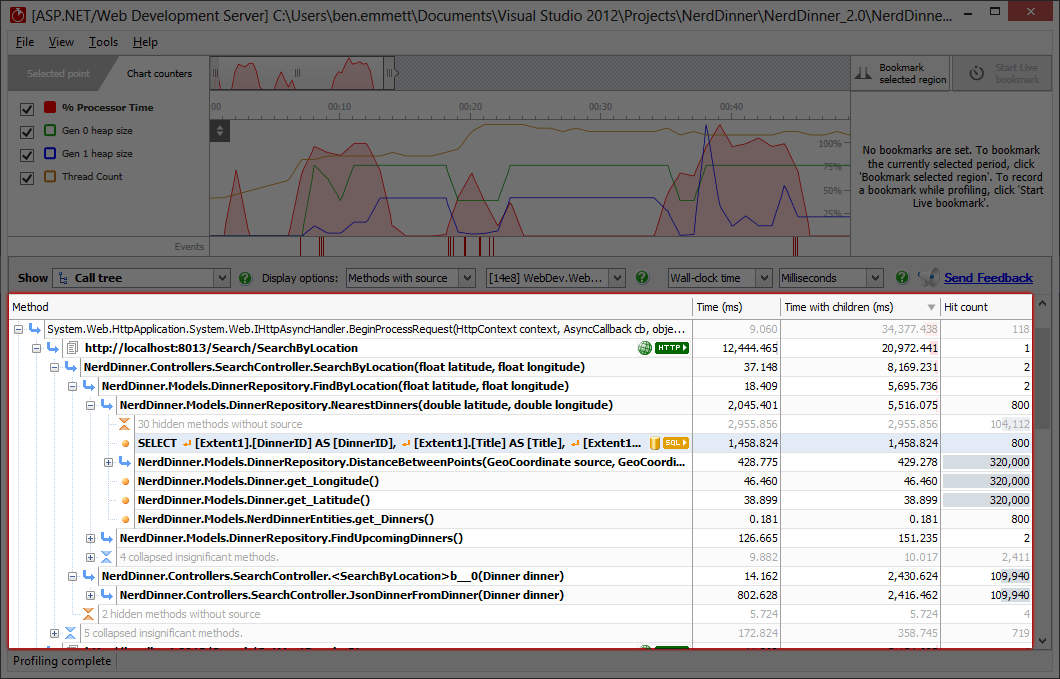
The call tree in the .NET performance profiler shows you data for every method and identifies the most expensive methods, database queries, and web requests.
Drill down to slow lines of code with line-level timings
Profile C# or any other .NET code line by line, with precise timing data so you can find issues at a glance. Expensive lines of code are automatically highlighted for quick visual inspection.
Look at your code's database interaction*
Understand how your .NET code makes database queries and how those queries perform. ANTS Performance Profiler supports SQL Server and Oracle databases, whether local or remote.
Capture outgoing web requests*
Look at your application's outgoing HTTP requests. Get data about the request and response headers, and see what .NET code caused them to run.
Immediate feedback on application performance
Use the interactive timeline to check the CPU usage of your .NET or ASP.NET application and highlight problem areas to focus only on the data that matters.
Group methods by HTTP request*
Code and database activity are grouped by HTTP request, exposing performance problems on specific web pages.
C# profiling for async code
Understand the performance of C#5 async code. View activity in the context of the code you wrote, and see how work being done asynchronously is related to the async method which caused it to run.
Decompile third-party code*
Find bottlenecks in third-party components and framework assemblies using integrated decompilation, powered by .NET Reflector.
NEW: Profile SQL queries
Relate timings for your individual lines of .NET code right through to the SQL execution plans. Find out exactly why your SQL query is running slow.
 Only for V.I.P
Warning! You are not allowed to view this text.