.netCHARTING v9.3
.netCHARTING v9.3
.netCHARTING enables your web site to display massive amounts of dynamically generated data quickly and easily through a visual interface. Built with 100% managed code using C# and provided with extensive samples in both VB.NET and C#, this high performance charting control also contains a feature rich data access and aggregation system with calculation support. We continue to add value and functionality (such as the gauge and dial chart added in 2.5, the geographic map chart and vector chart in 4.0, AJAX scroll / zoom in 5.0, organizational charts in 5.1, digital dashboards charts in 6.0, TreeMap charts in 6.1 and jаvascript HTML5 Charts in 7.0 and Circular Gauges in 9.0) to .netCHARTING with no separate add-on purchases required.
.netCHARTING Overview
.netCHARTING combines visually stunning graphics and a comprehensive interface to bring you one of the most compelling charting solutions available for any platform.
.netCHARTING utilizes the .NET framework and GDI+ providing a managed charting solution for C# and VB.NET developers working with ASP.NET or WinForms. Using the latest Microsoft technologies has enabled us to step beyond existing visual charting standards and produce visuals much stronger than typical dynamic charting solutions. In fact, we hope you will agree that the .netCHARTING visuals are even superior to high end desktop charting applications!
Major Features & Benefits
Charting Firsts
For years, .netCHARTING has pioneered new charting technologies, bringing clients unprecedented ease of use and automation without sacrificing the stunning visuals we have become renowned for. While competitors scramble to emulate our innovations, our clients continue to benefit; saving thousands of dollars in development costs through the rich set of Enterprise level features included with each and every .netCHARTING license sold.
A powerful new jаvascript and HTML charting solution has been added in .netCHARTING 7.0. Easily enable jаvascript Charting with seamless mobile, iOS, Android and tablet support, at no additional charge, with every .netCHARTING license sold. In addition to visual parity with .netCHARTING's stunning server-side output, our jаvascript charts provide advanced animation and rich client side interactivity support.
Get a fresh new look for your old charts without a single line of code! Automatically improve the look and feel of your legacy charts simply by using the latest version of .netCHARTING. If you are attached to your legacy look, you can easily maintain it with a simple setting and enable the new look on a chart by chart basis instead.
A powerful new charting product has been seamlessly integrated into .netCHARTING. Now developers can provide advanced interactive Silverlight charts with a simple property setting and no Silverlight specific coding required. This high end visualization solution is included at no additional charge with every .netCHARTING license sold.
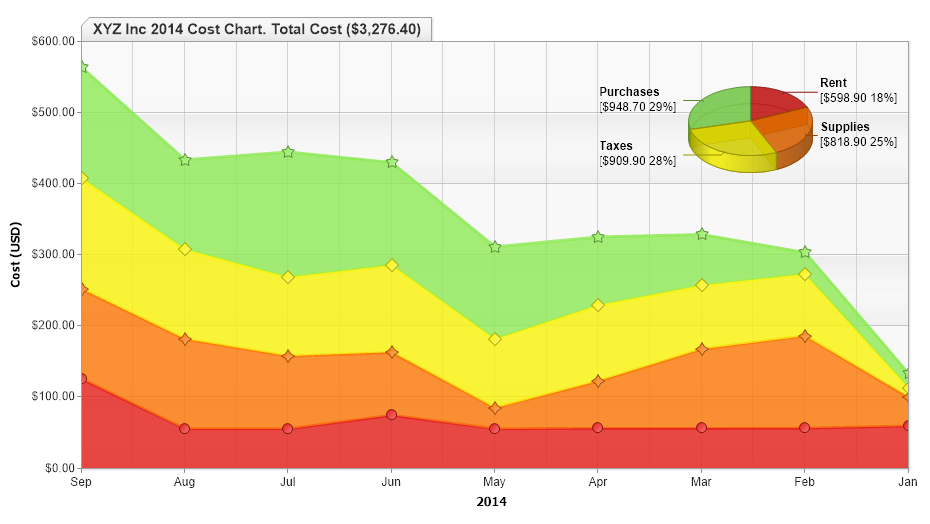
InfoGrids™ produce results similar to data grid controls; however, they are created and drawn within the chart image itself. As a result, an InfoGrid™ can be styled to produce a significantly more polished and integrated grid that users can take with them, along with that chart, in a single image file.
Complex tooltips are now supported with inline formatted image text, MicroCharts, InfoGrids and even full chart previews ideal for drilldown cases and to provide convey more information to the end user.
Define custom calendar patterns to implement axis markers. Calendar patterns will enable you to highlight a specific event or region of your data which reoccurs including marking weekends or other recurring events. They can also be used to trim data and to specify scale breaks.
Use tokens and mathematical expressions within labels to simplify the creation of dynamically generated labels.
An advanced new box header system has been added supporting 10,000+ unique combinations with the advanced alignment and endcap visuals, shadows, offsets and much more.
Often a chart has a few outlier data points which result in charts that are not legible for the bulk of the data. For example, if you had a chart of 100 values between 1 and 10 but 2 of the values were over 1,000 you could not accurately determine the values due to a compressed scale.
Maps support unlimited numbers of layers and can accept real data, readily available online, for the entire globe.
The chart mentor offers useful tips and samples based on the chart you are creating. It can help you resolve problems and improve the implementation of your chart in the most efficient way.
ImageBars™, provide stunning themed, pictorial representations in bar form.
Create multiple independent chart areas within a single chart image. Advanced automatic alignment functionality enables a single axis to span multiple chart areas and automatically align with each other.
More Charting Firsts
Other innovative features .netCHARTING has pioneered include:
Smart Labels Automatic Drill Down Automatic Date Aggregation
Automatic Scale Unit conversion between over hundreds of different units of measure.Multi-Color Lines and Splines.Legend boxes with customizable columns.
More Smart Features
Other innovative Smart features .netCHARTING includes:
Automatic Time LabelsAutomatic Time RangesAutomatic DrillDownSmart Minor Axis TicksSmart Scale BreaksSmart ForecastingAnnotation OrientationPattern recognition based element ordering.
Past and Future Development
See the complete version history for a detailed summary on the rapid innovations included in .netCHARTING since its original release. We are totally committed to meeting customer needs and provide priority support along with all major and minor upgrades with an affordable subscription offering.
New in version 9.3
Gantt Dependencies
The advanced Gantt chart capability of .netCHARTING is now even more powerful. Project task dependencies for critical path analysis can now be visualized on Gantt charts. Starting tasks can be set to depend on the completion of another task or a number of other tasks as a group.
Axis Range Ticks
'Range ticks' may sounds contradictory at first, but are a powerful new addition for axis labeling. Axis ticks traditionally refer to a specific point on an axis scale; however, now have gained the ability to define a range.
AxisTick CalendarPattern Values
Combining CalendarPatterns with axis range ticks provides a new and compelling way to visualize time scales. Enabling range ticks to be automatically drawn for every month, quarter, year (or any other interval) is as simple as adding one line of code!
Category Scale Names == Ranges
A new concept for category scales. String category names no longer refer to a single point on an axis, but rather a range. AxisTicks and AxisMarkers now accept either category name values or two category names that refer to a range that encompasses both categories.
Logarithmic Scale Improvements
Logarithmic scales now support zero and negative values. In addition, exponent format string 't' support is now available to shorten the large numeric axis values that often appear in logarithmic scales.
Point Axis Ticks
This feature automates complex coding tasks through a very simple API. A xAxisTick or yAxisTick property can be set directly on any data point (or the default) configuration object which adds an axis tick bound to point itself.
Axis Number Shortening and Magnitude Formatting
Large numeric values, which take time to read accurately, waste a lot of screen real estate.. Now, the axis can automatically shorten these values so that 56,000 turns into 56 k, 1,000,000 becomes 1M and so on.
Datagrid Control
A powerful and tightly integrated data grid that binds to charts and also acts as a stand-alone grid connected directly to your data.
Microchart and Icon Syntax
The simple syntax that allows microcharts to be added to any label on a chart is also supported in datagrid cells. In addition, icon syntax provides access to the full library of icons for seamless usage in datagrid cells.
Token Formatting and Expressions
The same formatting and expressions syntax supported within chart labels can now be used to define data grid column values.
Chart to Datagrid
An existing chart can show an alternative data grid of the charted data by simply setting the datagrid_enabled config option to true. A chart can also populate any div on the page with its data using the chart.toGrid('divId') function.
Export to CSV
When the datagrid CSV export option is enabled, a convenient button is generated that will save the data as a CSV file on the client's computer.
Accessibility
When accessibility is a company-wide requirement, JSCharting offers an uncompromising solution. Whether your organization must comply with section 508 or WCAG 2.0, you now have access to all the options to enable and control your chart accessibility experience.
Line Caps
Line caps add deeper meaning and context to ordinary lines by communicating line direction, colors and symbols. Line Caps are automatically set to enhance visualizations such as Gantt dependencies and range ticks and can also be set for other lines on the chart (even on line series).
Superscript and Subscript
Superscript and subscript text is useful for many advanced labeling needs and avoids having math equations or numeric values written as 10^5. Both superscript and subscript html tags can now be used with any labels in JSCharting and will correctly render as SVG text.
Updated Microchart Styling and Options
Microcharts have been enhanced with a clean and modern look.. Additionally, a rotate option has been introduced which is useful for custom fit and rotation requirements as well as rendering microcharts stacked horizontally or vertically across axis ticks.
Warning! You are not allowed to view this text.