JSCharting v2.9.0
JSCharting v2.9.0
Every JSCharting license includes the full suite of 150+ advanced chart types plus interactive stock charts, seamless grid and calendar support, jаvascript maps, Gantt charts, jаvascript Org Charts and micro charts at no additional charge.
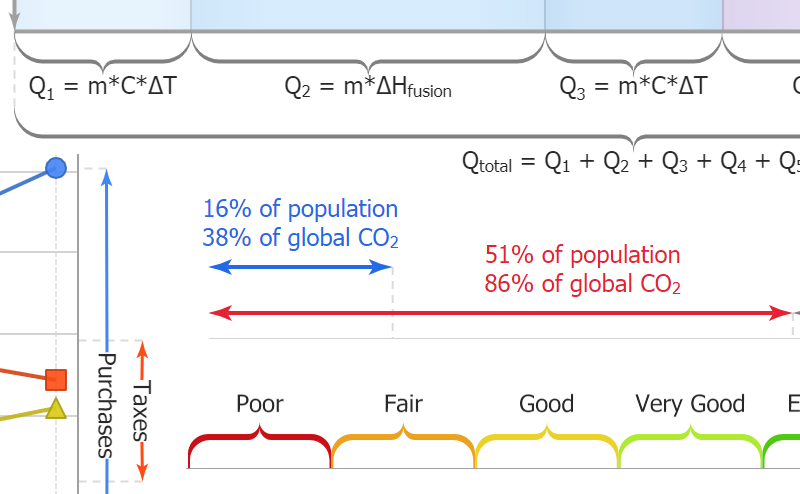
'Range ticks' may sounds contradictory at first, but are a powerful new addition for axis labeling. Axis ticks traditionally refer to a specific point on an axis scale; however, now have gained the ability to define a range. Simply specify an array of two numeric values in place of a single numeric tick value to enable the range axis tick visualization. Range ticks can display with three different visualization styles and will select the optimal mode automatically while also allowing for manual configuration.
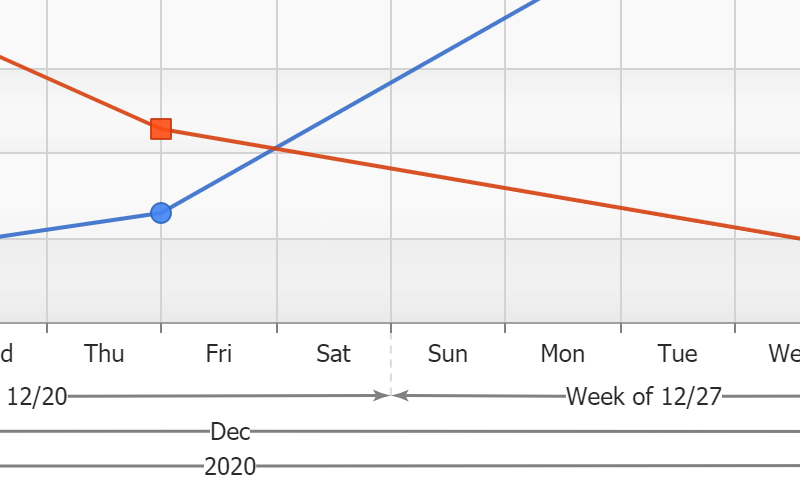
Combining CalendarPatterns with axis range ticks provides a new and compelling way to visualize time scales. Enabling range ticks to be automatically drawn for every month, quarter, year (or any other interval) is as simple as adding one line of code!
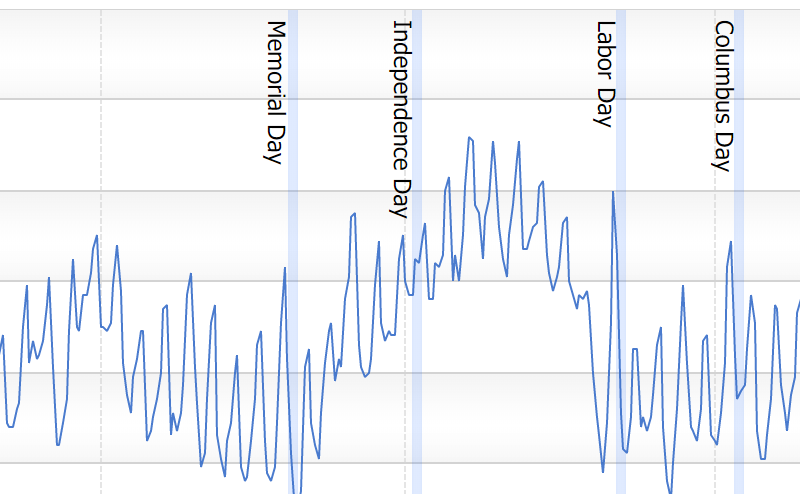
CalendarPatterns are a powerful shorthand API enabling you to define complex date patterns (such as rules for national holidays) or interval based patterns (such as weekends). These patterns can now be specified as axis marker values to mark important dates that may correlate with your data.
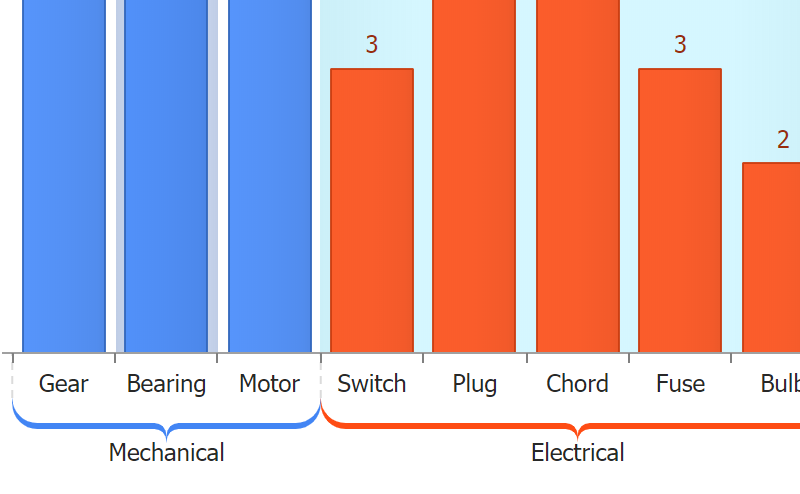
JSCharting v2.8 introduces a new concept for category scales. String category names no longer refer to a single point on an axis, but rather a range. AxisTicks and AxisMarkers now accept either category name values or two category names that refer to a range that encompasses both categories.
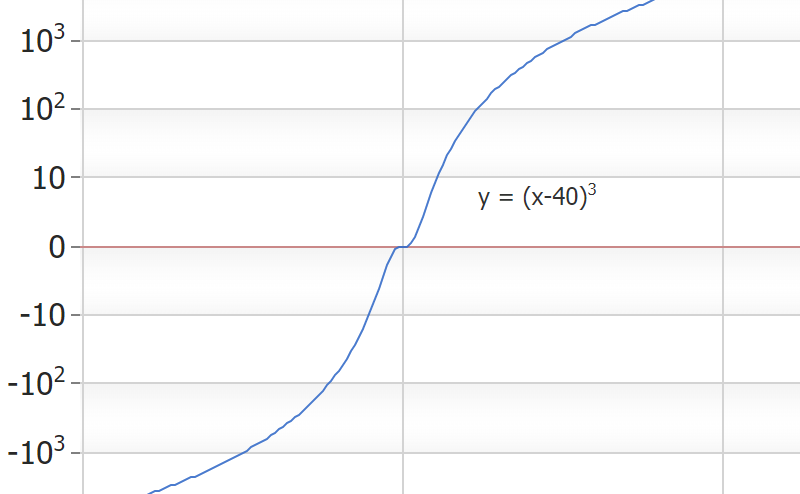
Logarithmic scales now support zero and negative values. In addition, exponent format string 't' support is now available to shorten the large numeric axis values that often appear in logarithmic scales.
This feature automates complex coding tasks through a very simple API. A xAxisTick or yAxisTick property can be set directly on any data point (or the default) configuration object which adds an axis tick bound to point itself. The value of this tick will automatically be set to the point value and the tick label includes seamless support for point tokens that describe the point.
The addition of range tick visualizations introduce a powerful new tool to describe sections of a scale. An axis that includes these visuals can now be positioned inside the ChartArea (negative px offset) or to a specific position outside the ChartArea (positive px offset) to gain more control of range and value tick layout.
Large numeric values, which take time to read accurately, waste a lot of screen real estate.. Now, the axis can automatically shorten these values so that 56,000 turns into 56 k, 1,000,000 becomes 1M and so on. This formatting option is also available as the 'a' format string and can be used with any labels outside the axis. When a number is added to the format string such as 'a2', it refers to a specific magnitude.
Version 2.8 introduces a powerful and tightly integrated data grid that binds to JSCharting charts and also acts as a stand-alone grid connected directly to your data.
The simple syntax that allows microcharts to be added to any label on a chart is also supported in datagrid cells. In addition, JSC’s icon syntax provides access to the full library of icons for seamless usage in datagrid cells.
The same formatting and expressions syntax supported within chart labels can now be used to define data grid column values.
An existing chart can show an alternative data grid of the charted data by simply setting the datagrid_enabled config option to true. A chart can also populate any div on the page with its data using the chart.toGrid('divId') function.
When the datagrid CSV export option is enabled, a convenient button is generated that will save the data as a CSV file on the client's computer.
The recent enhancements and support for delimiter separated value formats such as CSV can now plug directly into stand-alone data grids. This powerful combination can automatically detect CSV headers and interpret data to display the results as intended without intervention or additional manual settings.
When accessibility is a company-wide requirement, JSCharting offers an uncompromising solution. Whether your organization must comply with section 508 or WCAG 2.0, you now have access to all the options to enable and control your chart accessibility experience. In addition, color palettes optimized for color impaired viewers have been added to further enhance accessibility regardless of the specific form of color impairment.
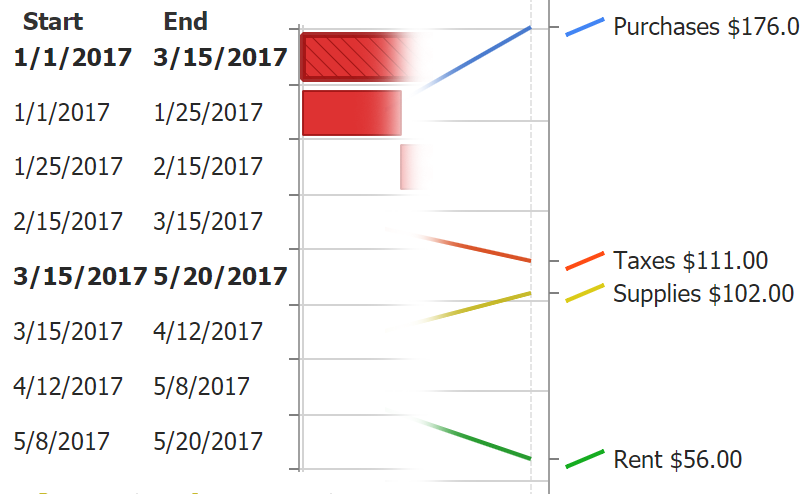
The advanced Gantt chart capability of JSCharting is now even more powerful. Project task dependencies for critical path analysis can now be visualized on Gantt charts. Starting tasks can be set to depend on the completion of another task or a number of other tasks as a group.
Line caps add deeper meaning and context to ordinary lines by communicating line direction, colors and symbols. Line Caps are automatically set to enhance visualizations such as Gantt dependencies and range ticks and can also be set for other lines on the chart (even on line series).
Superscript and subscript text is useful for many advanced labeling needs and avoids having math equations or numeric values written as 10^5. Both superscript and subscript html tags can now be used with any labels in JSCharting and will correctly render as SVG text.
Microcharts have been enhanced with a clean and modern look.. Additionally, a rotate option has been introduced which is useful for custom fit and rotation requirements as well as rendering microcharts stacked horizontally or vertically across axis ticks.
Other
Scroll panel on calendar cells labels that don't fit.
Scale column labels to fit vertically when autoHide=false
JSC.label() icon animations
Sparklines and Mini charts
JSCharting has extensive small chart support performance optimized for thousands of charts per page. Now it's simple to add charts inline in your tables and grids as sparklines are often used, but JSC support goes much further, allowing usage inline in labels, annotations and more. This powerful functionality is useful in all charts, but particularly powerful when used within dashboards. With over 10 sparkline and microchart types and variations seamlessly integrated, it's never been quicker or easier to visualize complex data in an intuitive and non-obtrusive way! As always, all these new chart types are included bundled with your JSCharting license at no additional cost.
JS Mapping Charts
Each JSCharting license includes the full suite of JSMapping functionality at no additional charge. Access an advanced an highly tuned set of maps for all countries / states / provinces in the world with no special coding or mapping expertise required. Advanced thematic mapping, map overlays, and dynamic loading are supported; to learn more view the feature and gallery samples.
Legend DataGrid
JSCharting's powerful token system can now be leveraged in legends with automatic scaling and advanced text sizing. This creates compelling legend grids to clearly communicate tabular data represented in the chart. While tooltips effectively serve usage cases with dynamic charts, legend grids are particularly useful for charts that will ultimately be printed or consumed in documents where such interactive features are no longer available.
UiItems
Add input controls (custom user interface) to a chart effortlessly to make your visualizations more dynamic and functional. This is particularly useful for enabling end users to select which data to display, viewing the data in a different way, or any optional settings that will help them visualize your data in the most efficient and intuitive way. The JSCharting API for adding uiItems makes such additions much simpler than using HTML input controls, even when using jQuery. In addition, charts are not bound to external HTML controls and can be moved to any page easily without losing full user interface functionality.
Functional Programming API
Intuitive development with the chart or any items within it is easier than ever with the new functional programming API. Nearly everything can be updated with the same configuration settings used to initialize a chart, significantly reducing the API surface area. Selecting specific items to update, then updating them, has been reduced to simple code that reads more like spoken language making it easy to learn and offering a much more efficient way to develop.
Label Tokens
Tokens can be used in labels to represent values and offer a much simpler way to manipulate label text.
Code Expansion
Automatic code expansion allows aliasing any property by typing it out in a single name. The chart will detect and expand the properties automatically. This feature can save a large amount of time by eliminating additional keystrokes necessary to achieve the same property settings without code expansion.
Globalization & Formatting
Effortless globalization enables quick and easy labeling in any language. A complete format string set is available and supports all numeric and date formats, including custom format strings. Combined, formatting and culture settings will automatically generate labels ensuring correct formats without requiring familiarity with the details of any language.
Smart Category Data Grouping
Datasets with partial or missing category data will be evaluated through a specialized algorithm to detect what the intended order of such a series may be. When such data is used with a chart, it will save a great deal of time by interpreting it automatically.
Arbitrary, Relative, and Docked Annotation Positioning
Annotations can be used as labels or annotations and can be placed anywhere on the chart relative to the chart top left corner, or the chart area's top left corner. In addition, annotations stack when docked to any chart area corner or side.