DevXpress Xamarin.Forms UI Controls 20.2.4
DevXpress Xamarin.Forms UI Controls 20.2.4
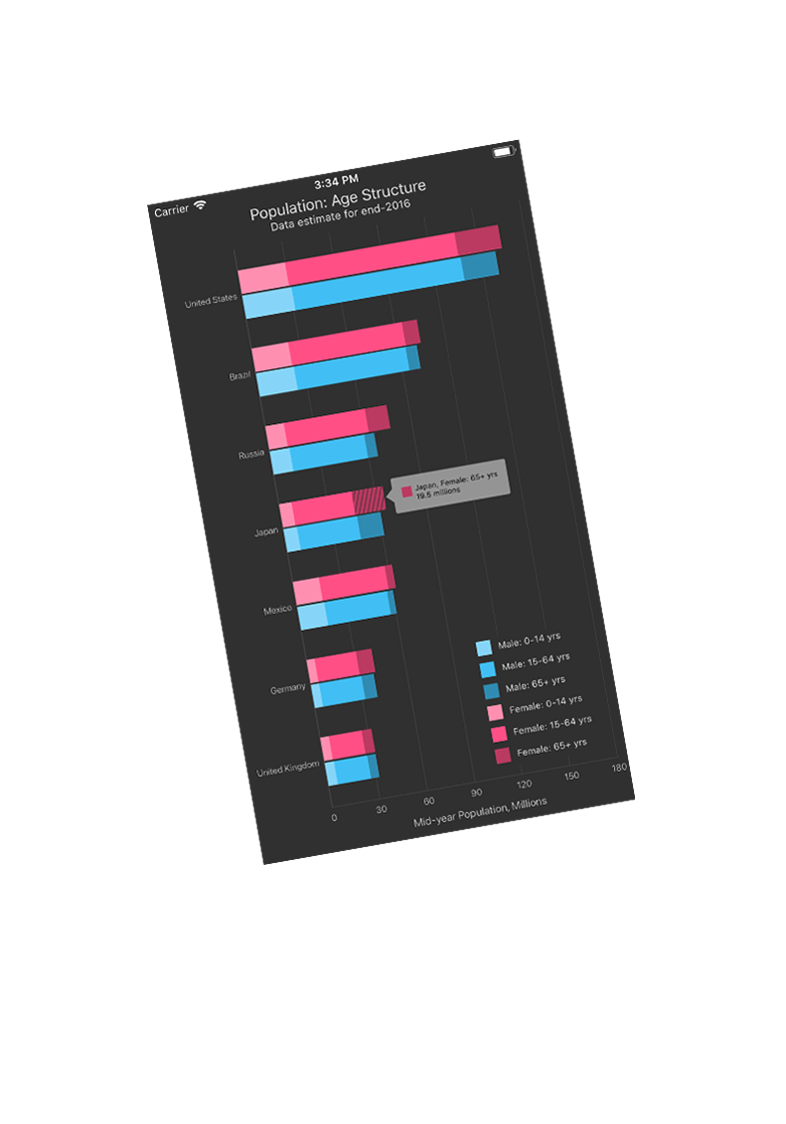
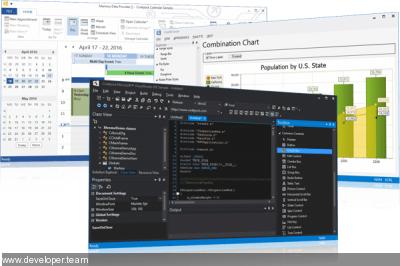
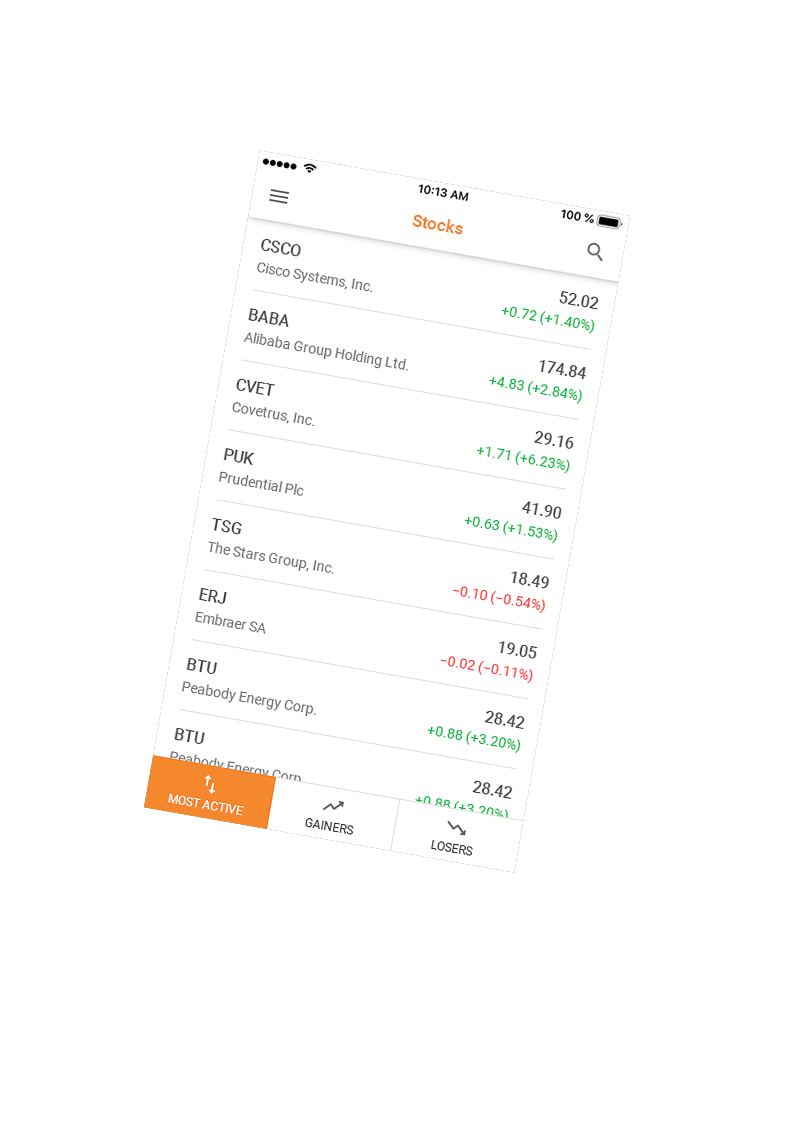
Deliver elegant and high-performance native mobile apps with the DevExpress Xamarin.Forms UI Controls. The suite ships with a feature-rich Data Grid, Scheduler, Chart, TabView, Editors, and utility controls.