Charts » Page 19 » Developer.Team

Aspose.Cells for .NET v19.5.0 + Xamarin Edition

Aspose.Cells for .NET v19.5.0 + Xamarin Edition


Create, Read, Write and Save Excel file formats as well as Export spreadsheets to various data sources without any Microsoft Excel dependencies. Aspose.Cells for .NET is an Excel Spreadsheet Programming API to speed up the spreadsheet management and processing tasks. API supports to build cross-platform applications having the ability to generate, modify, convert, render and print spreadsheets. Moreover, It does not rely on Microsoft Excel or any Microsoft Office Interop components to be installed but a robust set of APIs that deal with all Excel formats as well as CSV and SpreadsheetML formats.
Read more

GigaSoft ProEssentials Pro v9.5.0.20 Retail

GigaSoft ProEssentials Pro v9.5.0.20 Retail


Why ProEssentials? Take 10 seconds and run the demo! View our example code. See our documentation. Download and see first-hand the speed and rendering quality: Zoom the date-time, logarithmic and polar examples and study the axes and how well they behave. Stretch and size the pie charts and others and study their behavior. Rotate our 3d and simply play with our charts to experience our depth of logic and desktop quality. ProEssentials is a highly tested (distribution in the millions) robust commercial-grade charting library with an extremely simple property interface. Gigasoft regularly works with the largest and most technical organizations building the most serious desktop charting solutions. We have solved charting problems for over 20 years and our simple property oriented api simplifies success and maximizes your professional appeal.
Read more

Power-user for PowerPoint and Excel 1.6.640.0

Power-user for PowerPoint and Excel 1.6.640.0


Power-user for PowerPoint and Excel provides you with a deep library of templates, icons, charts, maps, and diagrams for your spreadsheets and presentations. With Power-user for PowerPoint and Excel, you’ll draw the attention of your audience with stunning graphics that are sure to impress. EDITABLE MAPS. Our 115+ editable maps are powerful tools to illustrate ideas with a geographical dimension. Maps are easy to understand and remember, and will and will help you better illustrate your point, thus enhancing your ability to convince your audience.
Read more

Winnovative Web Chart Control v7.1 ASP.NET and Windows Forms

Winnovative Web Chart Control v7.1 ASP.NET and Windows Forms


The Winnovative Chart Control for .NET allows you add data visualization capabilities to your web applications. It is a reliable, easy to use, highly customizable and high performance charting control built with 100% managed code. It is compatible with .NET 2.0, .NET 3.5 and .NET 4.0 Frameworks and offers full design time support for Visual Studio 2010 and 2012.
Read more

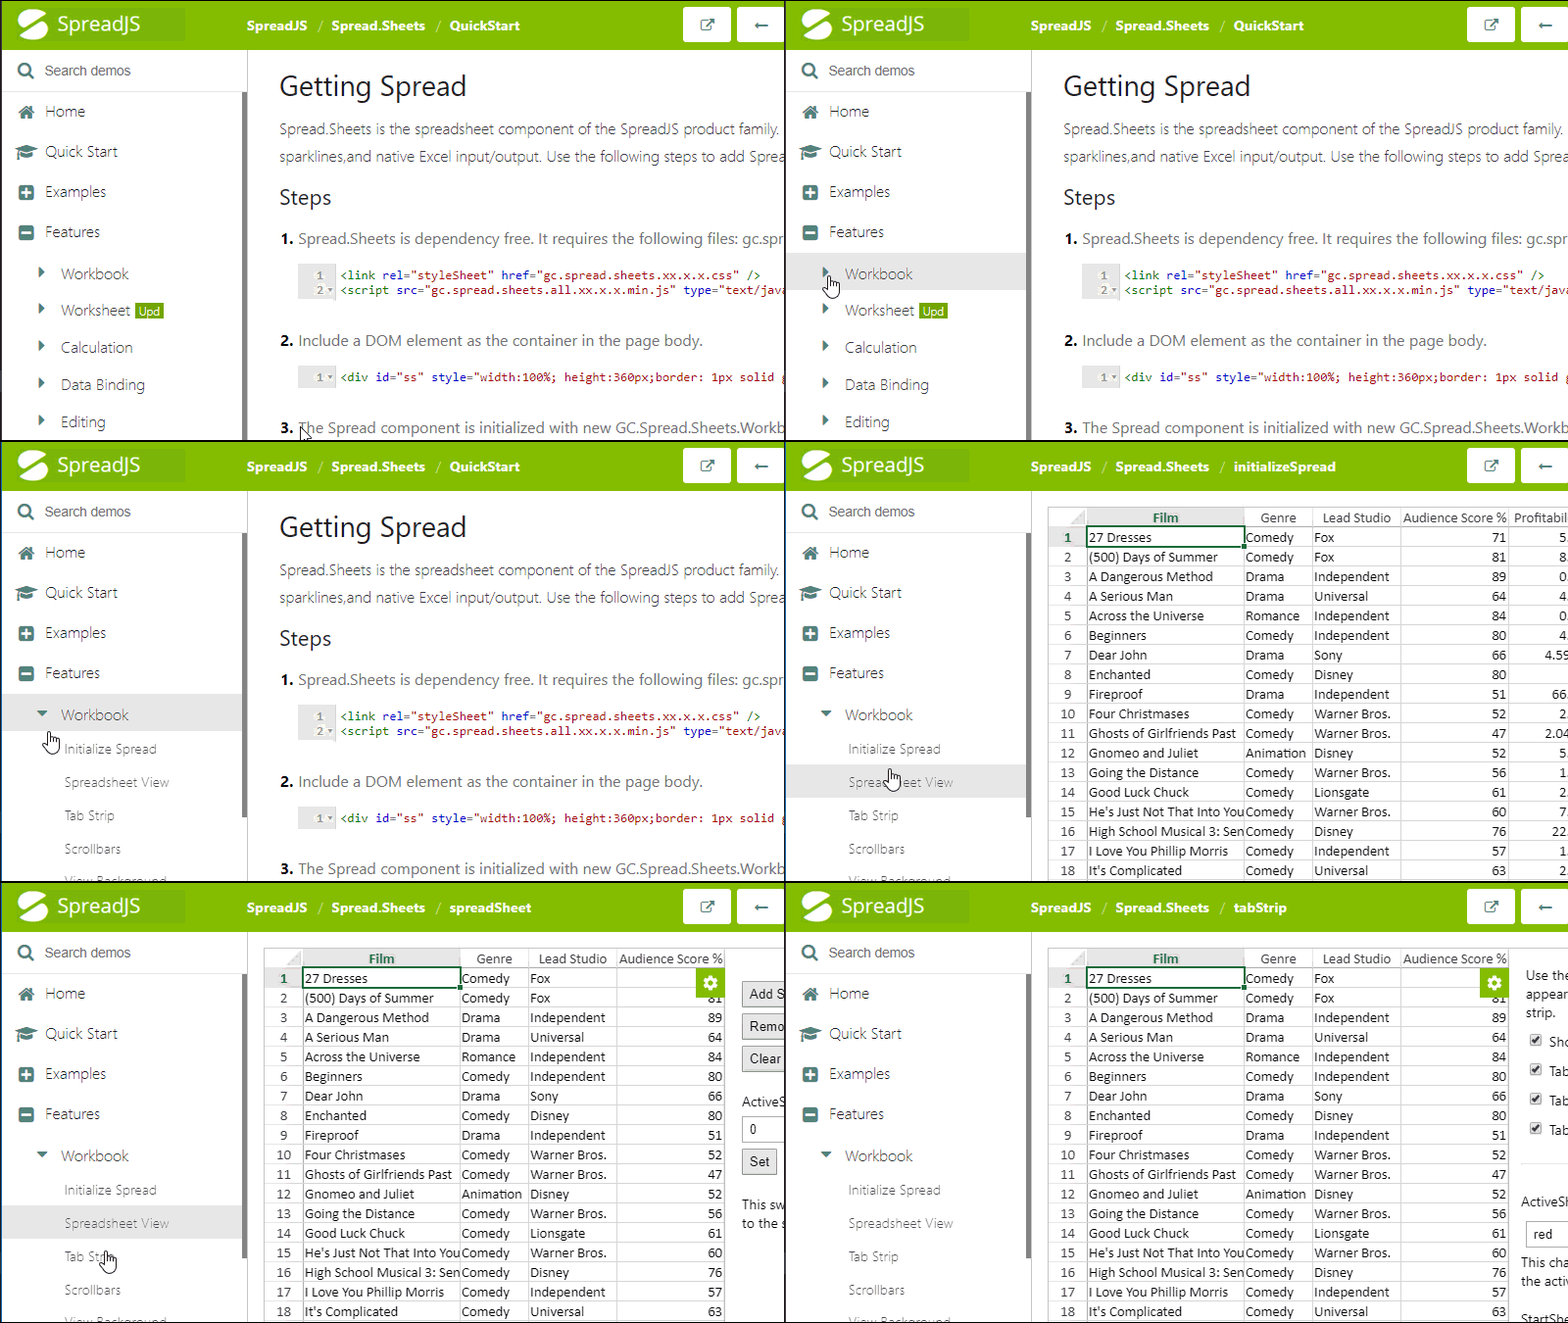
GrapeCity SpreadJS v12.1.2

GrapeCity SpreadJS v12.1.2
GrapeCity SpreadJS v12.0.7


Surpass the limits of a traditional spreadsheet with these Excel-like jаvascript spreadsheet components – and no dependencies

Deliver user-friendly Excel spreadsheet experiences, fast
Create spreadsheets, grids, dashboards, and forms with the comprehensive API
Leverage the powerful, high-speed calculation engine
Access 450+ built-in formulas
Import and export Excel spreadsheets
Pure jаvascript supports Angular, TypeScript
NEW! Full support for React and Vue
Read more

Telerik UI for Silverlight R2 2019 (version 2019.2.510) Retail

Telerik UI for Silverlight R2 2019 (version 2019.2.510) Retail


Telerik UI for Silverlight includes a wide range of controls from small UI components such as Rating to powerful data-driven controls like GridView. The suite provides a variety of data visualization tools which allow you to display and edit your data in many different ways. Manipulate your row data in a GridView or Spreadsheet and then visualize it through PivotGrid, or any of the other charting and diagramming tools. Choose from a number of components for daily or business planning such as ScheduleView where users can easily plan their day and GanttView which allows users to visualize and manage any project planning data. Telerik UI for Silverlight comes complete with customizable UI controls for a variety of needs and options, which makes it the ideal choice for any Line of Business Application.
Read more

SciChart WPF SDK (2D+3D) Enterprise v5.3.0.11954

SciChart WPF SDK (2D+3D) Enterprise v5.3.0.11954


SciChart for WPF is a Realtime, High Performance WPF Charting Library made with Financial, Medical & Scientific Apps in mind. Perfect for Projects that Need Extreme Performance and Slick Interactive Charts. Get the Job Done with our ~50 2D & 3D WPF Chart Types and Extensive API. SciChart WPF v5 now supports DirectX powered WPF 3D Chart Controls including Real-time WPF 3D Surface Mesh Chart, WPF 3D Point-Cloud Chart, WPF 3D Scatter Chart, WPF 3D Bubble Chart, 3D Column Chart and more … Our WPF 3D Charts are both real-time and interactive and allow zooming, panning, rotating of a 3D scene seamlessly inside a WPF Charting application, all using declarative XAML and MVVM as WPF was intended to be used.
Read more