TMS VCL Chart v4.4.0.0 Full Source
TMS VCL Chart v4.4.0.0 Full Source
DB-aware and non DB-aware feature-rich charting components for business, statistical, financial & scientific data.
TAdvChartView & TDBAdvChartView : fast multi-pane & DB-aware chart component
Single or multi pane chart view component
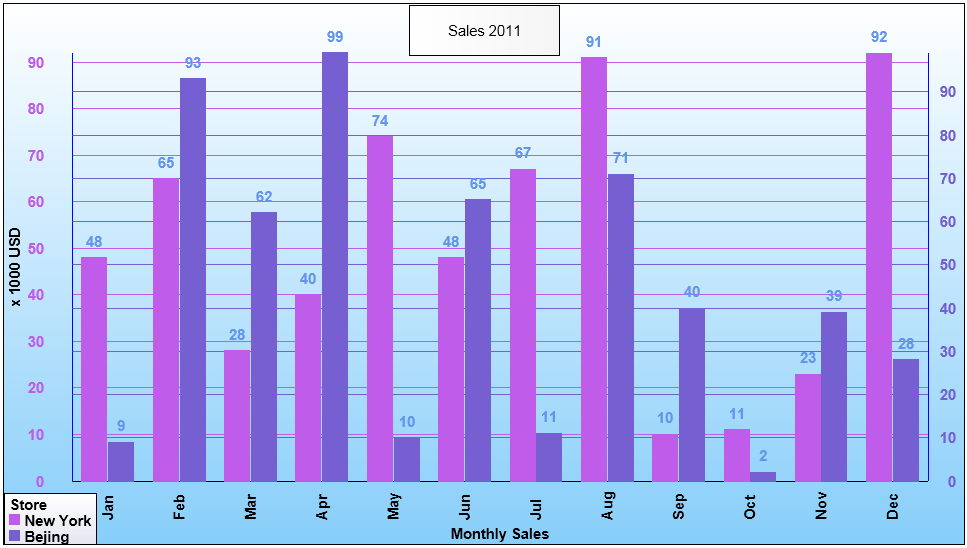
Vertical or horizontal oriented charts
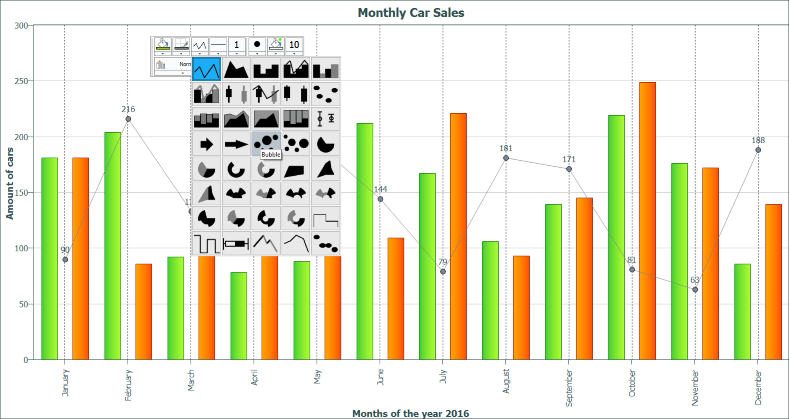
Wide range of chart types: Line, Bar, Area, Pie, Spider, Donut, Band, Stacked Bars, Stacked Area, OHLC, CandleStick, Histogram, Bubble, Error, Digital Line, Funnel ...