series » Page 8 » Custom Developer Tools and VCL Components | Developer Team

Infragistics Ultimate 2018.2 With Samples And Help Retail

Infragistics Ultimate 2018.2 With Samples And Help Retail


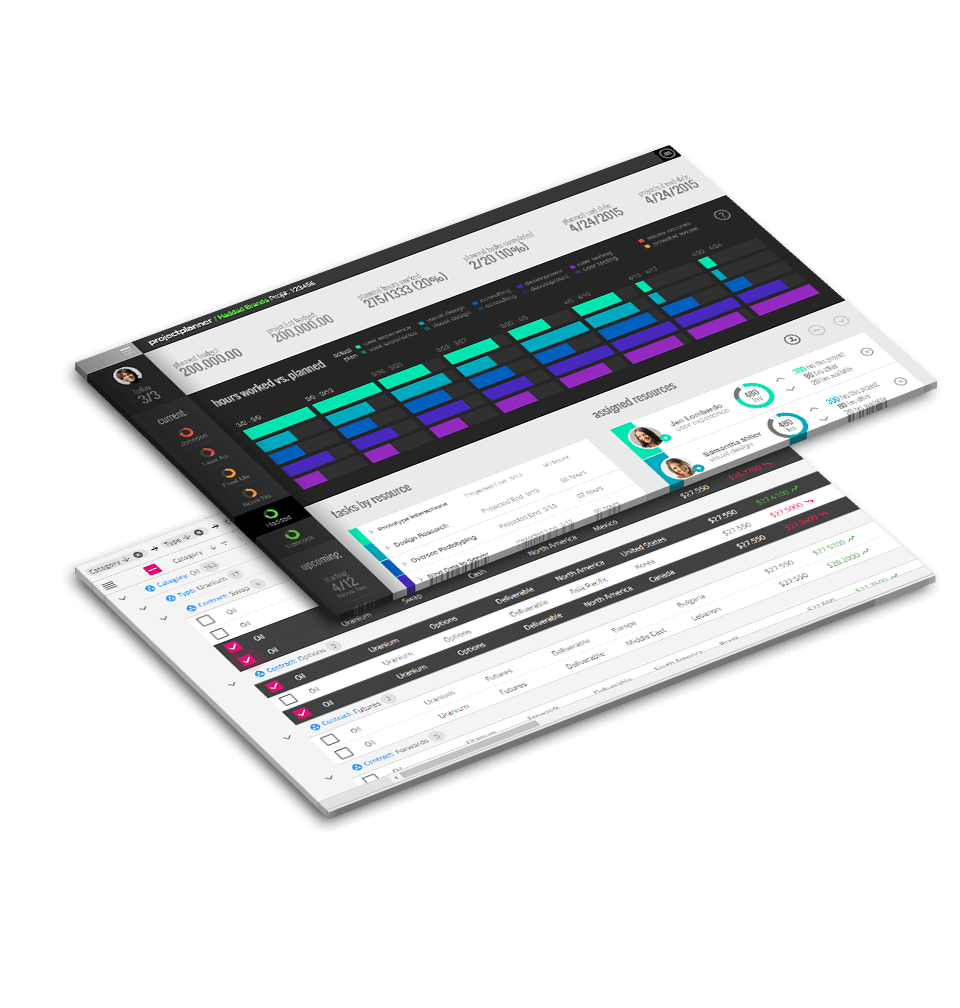
UI controls & productivity tools for quickly building high-performance web, mobile, and desktop apps. Build high-performing, responsive web applications in jР°vascript/HTML5. Works with Angular, React, and other popular frameworks. Build Angular apps with the native Angular components in Ignite UI for Angular. Includes ASP.NET MVC server-side wrappers.
Read more

TMS IntraWeb HTML5 Controls Pack 2.4.0.0 Full Source

TMS IntraWeb HTML5 Controls Pack 2.4.0.0 Full Source


TMS IntraWeb HTML5 Controls pack focuses on controls that take advantage of HTML5 capabilities to give a new powerful dimension to your IntraWeb web applications, including low bandwidth usage and ultra fast asynchronous updates. Currently the pack contains four controls: TTIWHTML5Chart, TTIWHTML5Gauge, TTIWHTML5PieChart and TTIWHTML5LocalStorage.
Read more

Arction LightningChart Ultimate 7.2.1

Arction LightningChart Ultimate 7.2.1


The fastest and most advanced data visualization components for WPF & Windows Forms! LightningChart Ultimate is the fastest 2D and 3D measurement, engineering and research data visualization SDK for .NET and Windows. LightningChart Ultimate is entirely GPU accelerated (Direct3D) and performance optimized data visualization control for presenting masses of data in 2D XY graph, 3D XYZ, polar and 3D pie / donut views.
Read more

Telerik UI for Xamarin R3 2018 SP1 (version 2018.3.1018.310) Retail

Telerik UI for Xamarin R3 2018 SP1 (version 2018.3.1018.310) Retail


Telerik UI for Xamarin uses the Xamarin.Forms technology, which makes it possible for developers to build native iOS, Android and Windows Phone apps from a single shared C# code base. The Telerik Chart and Calendar for Xamarin enables developers to easily implement various charting functionalities in their Xamarin.Forms projects and achieve the same scenarios across platforms using a single shared C# code base.
Read more

TMS FNC Chart 1.5.6.7 XE7-D10.2 Tokyo

TMS FNC Chart 1.5.6.7 XE7-D10.2 Tokyo


Fully cross-platform chart component designed for business, statistical, financial & scientific data.

Highly configurable cross-platform chart.
Support for VCL Win32/Win64, FMX Win32/Win64, macOS, iOS, Android, LCL Win32/Win64, macOS, iOS, Android, numerous Linux variants including Raspbian
Support for multiple series with optional separate or combined auto range for x- and y-axis.
Wide range of chart types: bar, grouped bar, absolute stacked bar, percentage stacked bar, area, stacked area, pie, donut, spider, line, digital line, OHLC, CandleStick, Boxplot,...
Read more

Telerik UI for Xamarin R3 2018 (version 2018.3.912.310) Retail

Telerik UI for Xamarin R3 2018 (version 2018.3.912.310) Retail


Telerik UI for Xamarin uses the Xamarin.Forms technology, which makes it possible for developers to build native iOS, Android and Windows Phone apps from a single shared C# code base. The Telerik Chart and Calendar for Xamarin enables developers to easily implement various charting functionalities in their Xamarin.Forms projects and achieve the same scenarios across platforms using a single shared C# code base.
Read more

TMS FNC Chart 1.5.6.6 XE7-XE11

TMS FNC Chart 1.5.6.6 XE7-XE11


Fully cross-platform chart component designed for business, statistical, financial & scientific data.

Highly configurable cross-platform chart.
Support for VCL Win32/Win64, FMX Win32/Win64, macOS, iOS, Android, LCL Win32/Win64, macOS, iOS, Android, numerous Linux variants including Raspbian
Support for multiple series with optional separate or combined auto range for x- and y-axis.
Wide range of chart types: bar, grouped bar, absolute stacked bar, percentage stacked bar, area, stacked area, pie, donut, spider, line, digital line, OHLC, CandleStick, Boxplot,...
Read more

TMS FNC Chart v1.5.6.5 XE7-D10.2 Tokyo

TMS FNC Chart v1.5.6.5 XE7-D10.2 Tokyo


Fully cross-platform chart component designed for business, statistical, financial & scientific data.

Highly configurable cross-platform chart.
Support for VCL Win32/Win64, FMX Win32/Win64, macOS, iOS, Android, LCL Win32/Win64, macOS, iOS, Android, numerous Linux variants including Raspbian
Support for multiple series with optional separate or combined auto range for x- and y-axis.
Wide range of chart types: bar, grouped bar, absolute stacked bar, percentage stacked bar, area, stacked area, pie, donut, spider, line, digital line, OHLC, CandleStick, Boxplot,...
XY line and XY scatter chart types.
Read more

Syncfusion Essential Studio Enterprise 2018.2 v16.2.0.41 with Source Addons

Syncfusion Essential Studio Enterprise 2018.2 v16.2.0.41 with Source Addons


Syncfusion, Inc., the developer solutions company of choice, announced its second volume release of the year: Essential Studio 2016 Volume 2, adding enhancements and features across all supported platforms. Two suites in particular Essential Studio for Universal Windows Platform (UWP) and Essential Studio for Xamarin received substantial enhancements.
Read more

Rt-Tools2D VCL for Tokyo Full Source Code

Rt-Tools2D VCL for Tokyo Full Source Code


Rt-Tools2D is a compilation of components for generating Cartesian X/Y-plots from scientific and financial data. It is available as VCL component package for Borland and CodeGear Delphi and C++ compilers and as .net Assembly for the Winforms framework of MicrosoftВ® Visual StudioВ®. It supports a large variety of axis scaling types, series, calculated line legends, movable markers, etc., and thus gives you a tool for generating scientific and financial graphing programs easily, while retaining numerous options for tailoring the end product to the requirements of you and your customers.
Read more